
Since my last blog in May of last year, I moved house (in December – we must have been mad), started a secondment with the Welsh Emergency Departments, and COVID-19 has created a ‘new’ normal.
Throughout the pandemic I have heard stories from across emergency care, primary care and public health, of people trying to move mountains to protect everyone
During my secondment, I have supported the roll out of the pioneering Key Performance Indicators (KPIs), one of the National Enablers for Service Improvement, developed under the Emergency Department Quality & Delivery Framework. These new experimental measures aim to understand the patient’s journey inside the open system of an Emergency Department (ED) and the first three KPI’s are soon to be published. I have also been supporting the EDs with their submissions to the NHS Benchmarking Network’s Emergency Care Project. Although you could argue this is not typical data for improvement, drawing on this information can support service change via a business case, a valuable lesson I learned a long time ago.
I’ve been meaning to write a blog about some experiences during this period, and it feels right the time is now.
So, why write about this now?
Throughout the pandemic I have heard stories from across emergency care, primary care and public health, of people trying to move mountains to protect everyone ahead of winter, all while dealing with the uncertainty of a crisis and the inevitable burnout. Alongside this, I’ve seen friends and colleagues on social media juggling day-to-day life and making huge personal sacrifices.
At the same time however, I see people in my local shop, not following the guidance around distancing or mask wearing, and people attending ‘COVID is a hoax’ protests, defying the request to follow a few simple rules. These rules, though straightforward to some, can unfortunately be misinterpreted and people start following ‘unwritten rules’.
When we consider all the actions being carried out for improvement during the pandemic, sometimes the data to support service change doesn’t show a change even when it ‘feels’ like it should. Is this because people are following their own ‘unwritten rules’ around these actions? Does this demonstrate flaws in our shared logic? Assumptions are made and we can start trying to assume what the data is showing by idealising the situation, rather than understanding what is actually happening.
Following a few simple rules
This brings me to the main theme of this blog: a few simple rules, a point in the right direction and it’s amazing what highly motivated and skilled practitioners can do. So how can this be applied to working with data – especially within the context of a crisis?
The most frequent topic I get asked about is data: 1. Because I am a nerd. 2. People often think they ‘can’t do data/Excel’. But I am not a data analyst. I struggled with data when I was clinical full time and was lucky to get a secondment where I could spend time learning how I could improve my approach to using data. So, over the next few blogs I will share some simple rules around using data, especially during a crisis.
Data and the big picture
These rules start from a fundamental idea that data often comes down to decision making, because ultimately the data should answer a question and inform a decision. And to do this effectively, there must also be an appreciation of the whole system surrounding the decision. Although that phrase does resemble Dr. W Edwards Deming’s wise words, it is his colleague Russell Ackoff I’d like to draw your attention to:
A problem never exists in isolation; it is surrounded by other problems in space and time. The more of the context of a problem that a scientist can comprehend, the greater are his chances of finding a truly adequate solution.
– Russell Ackoff
It is easy to assume that Ackoff means to get as much context as possible – when in fact in some instances you can’t. Gary Klein is quoted as saying that humans can make connections between things with a slither of evidence. I am guilty of thinking of that slither as a piece of a pie chart or part of a puzzle, as if there is more to see. I realised after reading his book, Seeing what others don’t, that he meant it more like seeing a single frame of a film and thinking you can guess the rest of the plot. It’s the same thing when doctors look at a patient and occasionally diagnose them on the spot – but they don’t know how; they haven’t got the whole picture yet.
To give you some advice on data, we need to think of systems or the context of the problem or situation. Data, like a problem, doesn’t exist in isolation, it is surrounded by pitfalls that can have temporal and/or environmental traps.
David Snowden’s Cynefin framework is a useful tool to consider when to discussing data for improvement.
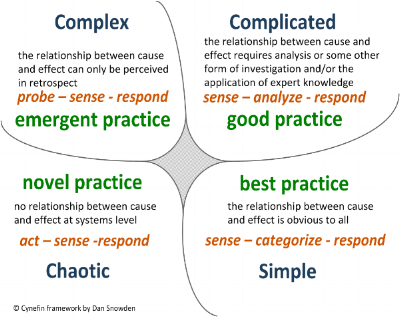
Working with data in the ‘crisis’ domain
Drawing on the four domains of this framework; if you are playing with data in Excel during a crisis – it’s either not a proper crisis or you have now left this domain; thinking strategically to break free of Chaos’ gravity and entering a Complex domain.
Ask yourself: am I in a crisis? The fact you even have time to ask this question means you aren’t. The title of this blog should probably therefore be working with data in disorder.
A crisis is chaotic, you don’t have time to think; you react to the situation, make sense of what is happening in the moment and respond in an automotive response. This is where true novel practice emerges, and a key type of innovation; discovery. When you are asked to justify your actions (after the crisis), retrospective coherence surfaces to explain away the risk and cover yourself – you don’t have time to crunch numbers, you tell the story.
Beware of people trying to create dashboards to make sense of the Chaos. The first thing that goes out the window in a crisis is the discipline of data entry…and rightly so, the crisis is more important.
Listening to the stories and looking for common themes will allow solutions to emerge, where we can shift the crisis in a tactical space before it can enter the complex domain – and start thinking how we can make best use of the data.
Over the next few blogs, I will explore a few simple rules for dealing with data we can derive from these domains.
Have you been managing data during the pandemic, Q community? Leave your experience of dealing with data in a crisis below.