Q Exchange
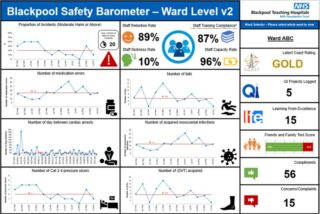
Developing the Blackpool Safety Barometer: An area-level virtual safety dashboard
- Winning idea
- 2022
Meet the team


Also:
- Alex Rose
- Louise Cheung
- Stuart Logan
What is the challenge your project is going to address and how does it connect to the theme?
The NHS Patient Safety Strategy highlighted that to improve safety, ‘insight’ needs to be accessible to staff. Without this, it is impossible to know if improvement is occurring. This has been highlighted by QI work done at the Trust, for example to reduce pressure ulcers (PUs), as summarised by a ward manager:
“ We weren’t aware of the statistics… (So when we had the) statistics…(it was) really good… I actually looked (and thought) oh, my God, what’s happened there…It made me…look at the staffing levels, the acuity of the patients, the type of patients that we had.”
This manager highlighted how having data helped them to look at safety in a different way and to “look at the bigger picture”. Therefore, this project wil aim to take this a step further and provide staff different routine safety data, in one place, to help monitor their safety.
What does your project aim to achieve?
This project aims to empower frontline staff to improve safety. Multi-disciplinary teams will be supported to develop and use their dashboards to make specific improvements. Each team will agree their own aim, and will also agree their own safety indicators for their dashboard, as their priorities for improving safety may be different. For example, a surgical ward may wish to monitor surgical site infections, whereas a cardiology ward may monitor cardiac arrests.
As BTH serves England’s most deprived areas, this will be a step towards improving healthcare for patients with some of the worst health outcomes. A man born in Blackpool has the lowest life expectancy in England, 10 years less than someone born in Westminster. Furthermore, the Trust has very high rates of certain harms, such as PUs. Between 2018-2019, BTH were an outlier compared to other local Trusts, and reported 1222 PUs, compared to 328 at Lancashire Teaching hospitals (from board reports).
How will the project be delivered?
The project will be delivered at pace, as improving safety in the Trust is urgent. Testing and development will be lead by an expert faculty including colleagues from the Risk team, QI team, the Informatics team, data analysts, frontline health care professionals and more.
The dashboard will be tested in Phases. Phase I will include testing the dashboard with three teams that are already working on improving safety culture, and have had an initial safety culture survey. This data will be included in the dashboard, but may also used as a wider outcome measure, as it provides an indication of whether staff feel that they have reliable safety culture and systems. Phase II, will also include a further three teams. These six areas will come together in a Breakthrough series style Collaborative, as this model has been used by BTH for other QI work and has received positive feedback.
How is your project going to share learning?
The project will be led by a multi-disciplinary expert faculty , with support fromt the Trust’s “Safety Movement Group”, established in 2021. This is a multidisciplinary group of staff across the Trust who are focussed on improving safety. The Safety Movement group, have already supported with co-designing the dashboard and Version 2 was based on constructive feedback from the group. We have also held awareness sessions on 10.05.22 and 12.05.2022 to gain feedback from Q members and colleagues from the Trust and other organisations. Feedback from these sessions have led to Version 3 of the tool. The next awareness session has provisionally been set for 20.09.2022.
In addition to progress being shared via our standard reporting structures, we want share our progress as widely as possible. The Safety Movement intranet site and twitter account will be used to share learnin and we will also aim to write a Quality improvement report to share learning.
How you can contribute
- We would love ideas from Q community members on how we can promote this and get frontline staff to take ownership of their safety data.
- We know that there are many Q members with experience of promoting Safety II practices and we want to use the dashboard to learn about what is going right, as it does most of time.
- We want advice on how we can develop dahboards that can be used by any area, but also can be adapted to suit indivudal needs regarding monitoring safety.
- We want advice on how we can evaluate and monitor the use of the dashboard over time.
Plan timeline
| 1 Oct 2021 | Initial Safety Culture Survey was conducted in division |
|---|---|
| 20 May 2022 | First safety workshop with Divisional leaders, including dashboard presentation |
| 25 Jul 2022 | First Safety workshop with Phase I teams, including dashboard review |
| 26 Sep 2022 | Second safety workshop with Phase I teams, including dashboard review |
| 2 Oct 2022 | Repeat Safety Culture survey to help monitor safety culture improvements |
| 27 Nov 2022 | Third safety workshop with Phase I teams including dashboard review |
| 29 Jan 2023 | First safety workshop with Phase II teams including dashboard presentation |
| 26 Mar 2023 | Second safety workshop with Phase II teams including dashboard review |
| 28 May 2023 | Third safety workshop with Phase II teams including dashboard review |
| 4 Jun 2023 | Initiate 1 year evaluation and further scale-up throughout trust |
Project updates
15 Jan 2023
We are now close to reaching the midway point of the Safety Culture Programme. Since our last update posted at the beginning of October 2022, the NHS has seen immense pressures around Emergency Departments and services across the UK. This however has not halted progress on the Blackpool Safety Culture Programme, there is a recognition that with increasing pressures the need to focus on patient safety is amplified.
Stakeholder Engagement
We have collaborated with our Business Intelligence (BI) Team to collate the necessary data required for the Blackpool Safety Barometer (BSB).
Bringing key stakeholders together using the MS Teams platform, for example: Performance, Clinical Audit, HR, Patient Experience, Patient Relations, Risk and Infection Control, opened up communication in a way which meant relevant stakeholders could collaborate together in a productive environment. This made it easier to extract varied pieces of knowledge held by individuals, which moved the project forward quicker than individual meetings. The group meetings are well attended and used to share updates as we work towards our vision.
Learning: to include a focus in initial stakeholder engagement meetings on the end user of the BSB and the impact on patient safety.
Challenges
Complexity of data flow throughout the different systems and understanding where/who collects and controls certain data.
Limited range of SPC chart types available to be deployed using the Trusts data visualisation platform.
Progress
Developed a process to collect and upload validated clinical data to the Trust data warehouse. This will also support other workstreams in the future.
Worked with 3 clinical areas to plan installation of interactive screens for use during safety huddles. Research into the limitations of the technology has developed and is ongoing.
Attended numerous workshops in preparation for project evaluation. These sessions will be particularly helpful when summarising the learning outcomes of this project.
Attended several facilitated coaching sessions, enabling collaboration and feedback from the Q-Community on particular challenges. These helped unblock and provide solutions to current issues.
1st draft BSB dashboard using limited SPC charts developed, ready for feedback and testing within clinical areas.
Began testing SPC plugin to work in conjunction with the Trusts data visualisation platform. Aiming to achieve the implementation of specific SPC charts based on data type.
Next Steps
‘Coffee and Cake’ launch event planned with area and department leaders. Gathering feedback from this session is a vital part of this project, enabling end-user collaboration to shape future updates.
Quality Improvement (QI) training facilitated to enable greater understanding of QI methodology and improvement science, it’s links to the BSB and wider impact on patient safety.
Installation of interactive screens in collaborating areas to be completed.
Manchester Patient Safety Framework (MaPSaF) sessions to be repeated, analysis completed on results and fed back to areas.
Work to begin with area specific teams to analyse data from the BSB, facilitating conversations about safety.
Teams to identify areas for improvement in their own departments and commencement of area-led specific QI projects.
QI work to commence in each area, using the BSB to monitor processes and outcomes.
How you can get involved
As a trust we are always looking to improve, gather feedback and work collaboratively. We welcomed feedback from the Q-community and received several suggestions and ideas early on in development. As the project moves forward, we’d still like to hear your ideas, thoughts and feedback.
Get in touch by using the comments section below or reach out to us on twitter @BTHQIHUB.
4 Oct 2022
We are very excited to share our first update with you. Since receiving funding for this project, our programme has been renamed the ‘Safety Culture Programme’ to recognise the importance of safety culture. The development of the safety dashboard, the Blackpool Safety Barometer (BSB) will support the programme to achieve its aims.
As the BSB develops, we have reached a number of milestones on the Safety Culture Programme. These include the successful appointment of a Project Support Manager, the agreement of Executive Sponsors and the recruitment of a multi-disciplinary Expert Faculty. We have also progressed with the technical development of the dashboard which has had its own challenges.
Firstly, the role of Project Support Manager has been filled by a member of the Q community and of our own Quality Improvement (QI) team. The role is a 12-month secondment and is tasked with running the day-to-day activities within the wider aspects of the Safety Culture Programme.
Secondly, we have managed to secure most positions on our expert faculty, which has taken a multi-disciplinary approach making sure we have a broad representation from many parts of our Trust. We have recruited members to provide the following contributions:
- Safety culture expert advisor, to advise on the latest thinking from safety culture literature.
- Performance lead, to advise on technicalities, data retrieval and data display.
- Risk lead/Trust Patient Safety Specialist, to advise on safety systems.
- Nursing lead, to advise on nursing activities, engagement and alignment of processes.
- Medical lead, to advise on medical activities, engagement and alignment of processes.
- Pharmacy lead, to advise on pharmacy activities, engagement and alignment of processes.
- Advanced Clinical Practitioner (ACP) lead, to advise on ACP activities, engagement and alignment of processes.
Additionally, we have been working closely with our Business Intelligence team to start gathering the necessary data required for our safety dashboard. Blackpool Teaching Hospitals have started to implement Electronic Patient Records in certain areas; however, the current format and scope of data isn’t as accessible as we would have hoped. We learnt very early on that the data we need is not housed in one location but on many different systems, so we have started building a database to hold the information required.
Lastly, we have attended a number of workshops with the Q-exchange. So far, including attending our first action learning set on 20th September 2022 which was very well received, we also attended the first ‘Getting Started with Evaluation’ workshop on 22nd September 2022.
To conclude, we have made progress on many of the different pillars of our Safety Culture Programme, the importance of agreeing our sponsors and expert faculty can’t be understated. We still face a lot of challenges we need to overcome; however, we have been inundated with support and enthusiasm from the teams and Trust and we are excited to do this together.


Comments
Sarah Jennings 16 Jun 2022
Hi. This looks like a really exciting idea, we had recently been discussing trying to develop something similar for our teams! I presume this will also be launched within the community teams in our trust?
Thanks
Sarah
Jo Scott 17 Jun 2022
Congratulations on the funding - I'll be following your work with interest. Sarah, in your comment you said you were hoping to do something similar. Our current insight project is exploring use of data to address issues of inequalities and backlogs. We're running action learning sets for members to enable individual and collective learning and to progress current work in this space, while also sharing insights and learning with others. Find out more about the project here or email me for more info joanna.scott@health.org.uk
Sarah Jennings 16 Jun 2022
Hi Parya
Thanks for the reply. Yes I would love to join the event on 20th September, I'll email the QI team.
Thanks
Sarah
Paryaneh Rostami 16 Jun 2022
Hi Sarah - thank you so much for this comment and the support.
Yes absolutely, the aim is to get it right with three teams before scaling up with a further 3 teams and eventually trustwide. We have had feedback from various community colleagues to try and make sure that the infrastructure will be appropriate when it is scaled up eventually. Our next awareness session is on the 20th September - would be great if you can join us - email the shared QI mailbox if you want more info bfwh.qualityimprovement@nhs.net.
Kind regards,
Parya
Samantha Richards 17 May 2022
This sounds like a brilliant collaborative project that gives professionals access to important data helping improve ways of working and care offered to families. A brilliant example of making data count and presenting it in a way that engages services.
Drop in sessions with staff to talk through the dashboard and how to interact with it could help with further engagement.
Look forward to hearing how you get on!
Paryaneh Rostami 18 May 2022
Hi Samantha,
Thanks for your encouraging feedback, the drop in sessions are really good idea. We actually do this for our other programmes, for example we run "pressure ulcer" virtual cafes for the teams who have been doing the pressure ulcer elimination work that we mentioned. We will test doing the same for this.
Glad you are looking forward to hearing more. We hope to hold an update session on the 20th September on teams. If you would like to/are able to attend please e-mail bfwh.qualityimprovement@nhs.net
Thanks again.
Parya
Michelle Chunger 4 May 2022
Thanks everyone for your comments, we'd love to hear more of your feedback at a session Tue 10th May at 10:00am via MS Teams. If you would like the link please comment below with your email or contact us bfwh.qualityimprovement@nhs.net
Kind Regards,
Michelle
Michelle Boot 4 May 2022
Interesting project. We are in the process of introducing ward level T charts for each ward for their falls and HAPU data. Ward staff engaged with this. Both HFC team and Wards finding them useful to identify areas needing additional support, and wards with good practice where we can celebrate and share learning.
Would be good to connect with you.
Best wishes,
Michelle
Katharine Goldthorpe 4 May 2022
Hi Michelle, great to meet you! We are planning to hold a virtual session next week to share our plans and to get ideas on how we can improve our proposal. Could we send you the invite? We would love for you to join us!
Kindest regards,
Katharine
Paryaneh Rostami 4 May 2022
Hi Michelle,
Thank you so much for your comment, we are looking to include both of these harms in the dashboard, and as mentioned in the proposal, have already been providing weekly, validated PU data to certain teams in our Trust. Qualitative feedback has highlighted that teams do find their data in charts helpful, once they understand the charts. We tend to use T charts for harm events that are more rare for us, like cardiac arrests. We have been using T charts for falls data with local care homes.
Would be great to connect, we are doing a virtual event next week to gain feedback about the barometer, we would love to see you there. For an invite please contact bfwh.qualityimprovement@nhs.net (more info has been provided in a seperate comment from my colleague Michelle Chunger).
Kind regards,
Parya
Jo Scott 20 Mar 2022
Hi all - this looks like a really promising idea - I hope you manage to engage other members with experience in applying Safety II practices - there were some really good webinars run by Q members on this a couple of years ago https://q.health.org.uk/event/the-quiet-revolution-in-qi-safety-ii-and-the-return-of-practical-expertise-andrew-smaggus-and-suzette-woodward/.
It may may not quite be what you are thinking but reading your summary made me think about teams that have been using Lean approaches to apply data to improvement projects. We profiled a couple here (case studies 1,&6) https://q.health.org.uk/blog-post/side-by-side-improving-in-partnership-with-patients-and-communities/.
Best of luck!
Jo
Katharine Goldthorpe 21 Mar 2022
Hi Jo, thank you so much for reading about our project, we are very excited about it! Also thank you for sending the webinar, we will definitely watch it, we are always keen to learn from the experts. In fact, I reached out to Suzette Woodward when we were designing our approach to improving safety culture and she gave us some excellent advice, most importantly start with engagement, gathering insight and then developing the programme of work. I think we're really at the insight stage. We're also heavily influenced by the work of Prof Charles Vincent and his framework for the measuring and monitoring of safety.
Our team have also recently been trained as "practice coaches" through the NHSI Vital Signs programme, so great idea re bringing lean into this space. Will definitely have a think about that.
We are really keen not just to deliver, but also to learn, so really appreciate the information you have sent through and your wise words.
Kindest regards,
Katharine
Samantha Riley 8 Mar 2022
Hello
This looks great! Would be keen to link with you on this regardless of the outcome of this process :-)
Best wishes
#plotthedots Sam
Katharine Goldthorpe 8 Mar 2022
That would be great Sam - and of course you're always welcome to visit Blackpool! We will keep you in the loop
Aklak Choudhury 4 Mar 2022
Hi All,
Love the concept of a ward level 'real-time' patient safety dashboard with a focus on patient safety, utilising run charts.
Can't quite see the detail on the dashboard. Intrigued to know which positive patient safety indicators you have chosen.
Thanks
Aklak
Paryaneh Rostami 7 Mar 2022
Hi Aklak,
Many thanks for your comment - the example in the image is a mock up and the indicators will be refined with testing. However, after MDT discussions with various colleaagues the positive indicators we hope to test in the first instance include:
Once again, thanks for your question, and I will try to make this more clear in the application!
Comments are now closed for this post.