Q Exchange
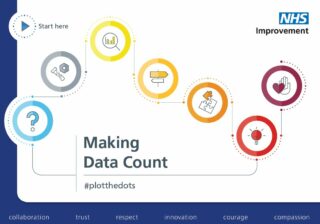
Making data count
- Winning idea
- 2018
Meet the team: From RAGs to Riches


Also:
- Samantha Riley, Head of Improvement Analytics, NHS Improvement
Most people accept that variation exists in their everyday life – whether this is your journey time to work or the time it takes to dry your hair. There are factors outside our control that we can do nothing about. In the quality improvement world we’re familiar with this concept.
But for many people, though, in their working lives they forget that natural variation exists. What is the result? Constant over-reaction to data which is simply normal. Whether it’s A&E performance this week being worse today than yesterday or the spend on a particular drug being higher this month than last. In many people’s working lives they regularly look at two data points and if the second data point has moved in the wrong direction, panic ensues. Investigations and action plans are demanded – and provided. A reason needs to be provided for that second number being ‘worse’. What if the answer is as simple as ‘the change in the data was due to natural variation’?
By acting in this way, valuable time is misdirected to ‘issues’ that do not exist and issues that require attention are often missed.
Similarly, the use of red, amber, green (RAG) distracts and misleads. ‘Green’ often provides false assurance that everything is ok whilst ‘Red’ can mask improvement.
The traditional ways in which the NHS uses data create a vast amount of wasted energy and effort. The use of Statistical Process Control as a way to look at data is well used in industry and is well established in quality improvement work in healthcare, but not in the wider NHS. It identifies when something unusual is going on which merits investigation – whether good or bad. It enables us to see whether the changes that have been implemented have made a positive impact, and identify opportunities for learning.
SPC enables us to understand which issues need to be understood and which issues truly merit investigation. It’s a brilliant tool to ensure we focus the time of busy people working in the NHS on areas that will improve the system and benefit patient care.
So, why don’t more people in the NHS use this technique? People may not be aware of SPC as an approach, or see it as being a tool ‘just’ for the quality team. Even if they are aware, they may not have access to the knowledge and tools to analyse the data in this way and make the correct interpretation. They may have seen so many reports with red, amber, green (RAG) over the years that they can’t imagine that there is a different (and more powerful way) to analyse data.
On 16th May, NHS Improvement published a new interactive guide : Making Data Count https://improvement.nhs.uk/resources/making-data-count/
This valuable resource helps people understand the pitfalls of two point comparisons and RAG reports and learn about the value of looking at data over time and using SPC. This guide gives people the knowledge and tools to be able to create and interpret SPC charts and encourages closer working between analysts and decision-makers in all sectors of the NHS. The intention is that Making Data Count supports more effective decision making in the NHS and makes a real difference to patients.
Whilst this is a brilliant guide, more is required to accelerate how the NHS in general can make the best use of data. This bid is proposing an approach to upskill keen analysts, clinicians and managers to become ‘Making Data Count Champions’.
‘Champions’ will be put through a programme which:
· Increases their knowledge and understanding of the approaches described in Making Data Count;
· Increases their confidence of using the tools referenced within the toolkit;
· Enhances facilitation skills to enable each champion to facilitate local workshops and board education sessions;
· Provides tips and techniques for supporting effective data conversations #talkthedots
A network of Champions will be created to share the experience of encouraging people within the NHS to make the best use of data. The feedback and experience from Champions will inform additional support offers developed and delivered at both a local and national level. There is already a huge appetite for this, and we would anticipate champions acting as key network weavers in the developing ‘Making Data Count’ revolution!
This bid has the potential to make a significant and long term positive impact on the decisions made by people working within the NHS to benefit patients. Part of the funding applied for will be used to evaluate the impact of the interventions outlined in this bid.
How you can contribute
- Think about how the Champions role could work in your locality/area of work
- Make suggestions with regards to what else can accelerate the adoption of best practice with regards to making the best use of data
Further information
NHS_MAKING_DATA_COUNT_FINAL (PDF, 5MB)
Reviewer feedback
This is a great project because…
We know that using data for improvement is a top interest area for the Q community. This project addresses a systemic issue and offers great potential to engage beyond analysts and through Q reach organisations across the system. We like the two way iterative relationship between the centre and the members of the champion network.
By the time of the event we encourage the project team to think more about…
How the champions network will make the most of the interface with Q and how the work can be sustained.


Comments
Simon Dodds 15 Jun 2019
I shouted "hurray" when I saw the "Making Data Count" publication because RAG charts have plagued NHS performance reporting for decades and have been an unintended barrier to improvement. Presenting data as time-series is a more efficient and effective form of visual communication and we use it every day in health care e.g. a patients vital signs chart. Many do not realise that statistical process control (SPC) charts are actually a quality control tool for a manufacturing process that is designed to be highly repeatable and predictable. Is it possible to share an update on the progress of this project? Has challenging RAGs and offering a better alternative had a measured impact and what can we all learn from this? Do we need to improve the design of SPC to make it better suited to the different context of health care system improvement?
Jo Pritchard 5 Oct 2018
Really interested in getting involved in this project if I can. I've been running in house Measurement for Improvement training courses at my Trust & encouraged by the enthusiasm to learn more. I'm big on the need for actionable information and insights - too much analysis paralysis!!
Alison Cracknell 27 Sep 2018
Yey! great work Kate and Carolyn. Look forward to seeing it evolve. Good luck. Ali
Paula Reilly 20 Sep 2018
Really looking forward to seeing this work progress. People cut data to make it show what they want it to, to support or disprove their points as required. Clear reporting leading to considered and proportional reactions is just what we need, rather than the knee jerks that we typically end up with. Can't wait!
Sarah Williams 30 Aug 2018
Hi, have recently been to a workshop on this and it is exactly what we need - the best part is the use of your own organisational data in training...
it would be great to look at how this works in line with QI reporting too, and to have some easy to follow notes on how to interpret so anyone can follow them? Even when used SPC chart info can get muddled in the reporting? Having public/ patient data testing might make a nice element of the champion role?
As as I read this I wonder if it would be a useful 'add on' or component for patient QI training... would love to chat about this?
good luck
Sarah
Fran Butler 13 Aug 2018
This sounds like a great idea - champions who can support each other in this work is a great way forward to helping people use their data including knowing when/whether/how to react to it. The training given at the start sounds really beneficial to the roles the champions will be playing.
It would be useful to know a little more about how the network will run and support its members on an ongoing basis?
We are also interested in thinking through how we might benefit from this approach in our ED Mental Health Frequent Attenders bid which is also shortlisted.
Andrea Byles 7 Aug 2018
This is a great tool, great for clinician and analyst alike. Is really helping to change the way we present data at this Trust. Thank you I support this project totally.
Tim 27 Jul 2018
This is fab and long overdue. Everyone complains about NHS systems not talking to each other and how we don't make use of 'big data'. But we need to recognise that we have a ton of data, much of it very good, but we don't really make it work for us. I spend a lot of time explaining to commissioners and others that their performance management efforts are fundamentally flawed simply because they have not understood how the data relates to real services, real clinical practice. A ton of money for this programme please.
Thomas John Rose 24 Jul 2018
Data is only of value if there is a good understanding of the process from witch that data is derived. A process map, clearly showing at which point in the process the data is being collected, is a good way of gaining this understanding. A clear picture can then be made of what is influencing variation in the data and thereby giving an indication of where improvements can be made. I would be pleased to help in the area of process mapping if requested. Regards Tom
Hein le Roux 19 Jun 2018
This is a great idea. It can be a challenge working in an environment that responds to single data points and so anything that increases people's awareness of trends in the form on a run chart or SPC would be so welcome. It also prompts people to ask more quality improvement questions which help overcome the inherent defensiveness in people.
Helen Smith 17 Jun 2018
Hi both
Music to my ears!!
We are just starting to work with MH Trusts as part of our new safety improvement programme in MH. I can see that we might be a great test bed for starting to do some of the work you are describing. Better understanding of variation will be key to us delivering improvement through our new Mental health Collaborative programme.
Happy to talk further as we are likely to be meeting up fairly soon, Kate?
Thanks
Helen
Elizabeth Beech 25 May 2018
Count me in to support this - esp within the pharmacy profession who have some great prescribing data but lots of room to improve how its used to drive change. #plotthedots is a great initiative
Doris Behrens 24 May 2018
Hi Kate and Carolyn,
your Make Data Count document is a really lovely "starter" to cover the technical issues around SPC charts for anybody who wants to understand data (better)! And you are right (thanks for the encouraging comment, Kate :)) that our #StorytellingForQI with data idea complements your project excitingly well -- as we explore the psychology behind the perception of charts. A word on the selection of champions. We are running a programme, called ABUHB Measurement Leads, that (since last November) has so trained around 50 staff within our health board (Aneurin Bevan University HB) in stats, SPC and displaying data. These Measurement Leads or "Champions" are mostly non-analysts -- predominately middle management, consultants and nurses. The highest impacts we currently observe for frontline staff and consultants who properly understand data and are therefore able to learn and adapt processes in the spirit of continuous improvement. Very interested to learn where your journey takes you!
Kate Cheema 22 May 2018
Thanks both for your comments.
In terms of Champions, really keen to have people from a range of backgrounds- to some extent this is about the democratisation of data- its not just for analysts, its for everyone to support decision making. We're planning on delivering local 'train the trainer' sessions with ongoing support from the existing #plotthedots community (about 800 strong so far!) and potentially link in to the Improvement Analytics Team, the Patient Safety Measurement Unit and other expertise we have access to as 'expert' support. In addition, really keen to build the network of Champions so there is a peer support network as well, but to be honest haven't thought in detail how to do that yet!
Your point about local testing is a really good one Elizabeth- will consider that in more detail....
Kate
Mirek Skrypak 22 May 2018
Hi Kate and Carolyn,
Love this publication and very interested to explore how there may be some potential for mutually supportive work with our proposal Speed DATAing, particularly at national level. Also interested to know if the champions would be from a specific role or background? What are your thoughts?
BW
Mirek
Elizabeth Beech 21 May 2018
Great idea and much needed and this will support the #CatchingCanaries project too - check it out. How will you select champions? Do you plan to target a defined geographical area to test the idea? How will you support the champions at local level?
Comments are now closed for this post.