
This blog is the fourth and final in a series, read the previous blogs in the series.
If you have read my previous blogs, you will now have an appreciation of the type of domain your data is in and its potential limitations. Next, you want to understand why it’s limited and be able to explain this to others.
Using the limitations checklist you can make sure you understand what you have to communicate with others and show an understanding of the pitfalls. For example, data rounded up to the nearest hour can’t be used for real time analysis if patients turn up every five minutes. That may sound daft, but I have seen data divided by 60 to give an average; to illustrate this, the pitfall is if 42.7 patients had turned up in ten minutes, you’d be measuring 0.7 of a patient.
This brings us on to CSWME. It is not a welsh word, it’s a little framework that a colleague and I use to explain the approach to using data once you know its limitations:
Counting – Ask yourself, what is it you really need to be counting? How many times does the activity occur? Is it correct in the data? Is it the number of patients or the number of appointments? In primary care, those two things might not be the same thing; one patient can have a 20-minute appointment but it’s actually two 10-minute appointments joined together.
Specify – Of all the activities occurring in the data, are they different in some way? Can you identify this in the data? If not, is there a clue somewhere that can help you? For example, what type of appointments were they – GP, nurse, practice pharmacist?
Witness – If you don’t do the activity yourself, go where the work is (some will know this as Gemba) and see how the activity is recorded. Ask the people that do it (does it increase the FUPS score or add to your list of limitations?). This sort of insight will help pennies drop and match data to the Work as Done, not the Work as Idealised. This is where you might see the same activity done by different professionals – do they input data during the appointment, or after it? This would make appointment time less reliable, but there might be pro’s to doing it.
Measure – Notice, this is the first time in the blog I have mentioned ‘measures’. Everyone is quick to set up their improvement measures without considering the above. It is only once you are aware of the FUPS checklist that you should start considering which charts are best suited. Are there multiple processes in the same task? Then it shouldn’t really go in a Single Process Chart. A run chart will be fine for general trends. Does the chart you are using answer the question that needs answering? A reduction of one thing isn’t always a good thing. Balance / Environment measures really need to be on point to help persuade people that the change did not occur due to something else in the system. Maybe it only works well when the other part of the system operates in a certain way and the detective work will uncover that collaboration is required.
Evaluation – If the above has been considered and you’ve reached this part of the list with confidence in the failings of the data, you can share your charts and data with people and take on any awkward questions to evaluate it with them. Do the measures show a reasonable change? Is it an ‘adequate solution’, as Russell Ackoff said? If it’s a low score but the data shows a change, is it convincing enough to embed the changes? Is there a liminal time period before the change is made and then seen, is it within a window you can be confident is due to your interventions? Rather than it being a seasonal variation (not literally with the seasons of the year; it could be something that happens every three, four, or eight months and has its own rhythm or pulse).
So, where am I going with all this?
Even when someone has had improvement training, they are at the whim of their SHELL: Software, Hardware, the Environment, the Liveware (patients/service users) and the central Liveware (themselves). I was introduced to the SHELL model from Intergrated Human Factors by fellow Q member, Isabel Ho.
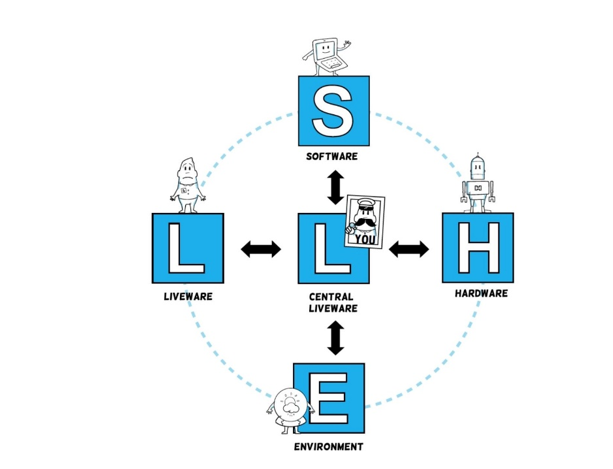
In the context of data usage, an understanding of how the data is captured by the software (free text or a pre-selection), what system it is captured on, whether the physical environment affects data capture (the computer is through 7 double doors) and whether it affects comparisons between other sites, colleagues or patients, are all part of the detective work.
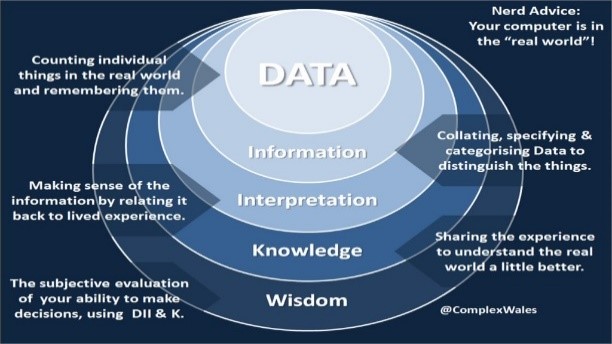
Whether it’s the study in PDSA, probes in the Cynefin framework, qualitative or quantitative (be honest – how many of you thought I was only thinking about numbers this whole time? A word cloud is a legitimate version of data visualisation and so is a proper thematic analysis), we act on our interpretation of the information in the hope that the knowledge we have gained will help us make the right decision in the real world. We gain wisdom by evaluating and reflecting whether we made the right decision.
Having an appreciation of systems and data, doesn’t have to be daunting – just watch out for the traps and consider the domains.
I will leave you with my favourite Ackoff quote and image:
“An ounce of information is worth a pound of data. An ounce of knowledge is worth a pound of information. An ounce of wisdom is worth a pound of knowledge.”
Since writing these blogs I was mobilised to support the Public Health Wales Health Protection team with Home Office Ports & Borders data. Though this has been mainly taking data and turning it into information for Test, Trace, Protect (TTP), I have found that what I have shared over the course of these blogs, still holds true. I would like to dedicate this last blog to them and the TTP teams across Wales.