
This blog is the second in a series, read the first and second blogs in the series.
Systems thinking involves heuristics rather than rules; when there is order to things. If you’re dealing with system-level data, don’t treat it like a process which has order.
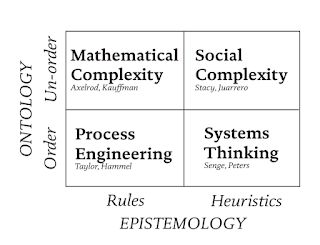
Mathematical modelling (pictured right) is useful when there are known rules and order. This works for data modelling services, such as Netlogo, which attempt to model Social complexity; the behaviour of humans. However, without professionals to help us with this we have to work with the dirty data.
In Complex and Complicated domains (see the second blog for more information on this), if we are dealing with system-level data, it often doesn’t seem to coincide with the cause and the effect. The change might have eventually rippled through the system or multiple changes had to be made at the same time to get the end result – which some consider heresy!
This approach does have its place in modern improvement – if you are skilled in setting these changes up. Requests I receive usually come from people who are convinced a change they have made works; they can see and hear it in their clinical work but need to convince others. If we can use the data taking the issues above into account, can we provide some assurance to compliment the clinical insight? In this situation, the more context around the data you can provide, the better the output will be.
FUPS – Flawed, Uncertain, Proximate, Scarce
‘FUPS’ was first introduced to me in a presentation by Dr Miranda Wolpert at the ‘We need to talk about Complexity’ conference hosted by Professor Trish Greenhalgh. I’ve adapted it for my own uses within using data for improvement.
My brain works backwards on this – self-assess your data and see where it sits from a data quality point of view. I’ve done a rule of thumb scoring system:
Scarcity – Is all the data there? Whether it’s the number per day or year, is it right when you’ve asked people? If not, rate it out of 5: whether it’s all present (5/5) and correct or it’s not all there (1/5). The only thing lower than this is a blank piece of paper.
Proximate – How close to the source has this come from? If it’s come from the computer people use to store the data: 5/5. If you got it from a big data warehouse that has gone through multiple people ‘cleansing the data’, take heed; it’s not close to the source.
Uncertain – Is the data an accurate representation of what the person inputting the data was seeing in ‘the real world’? My example is a ‘both knees MRI scan’. We scan knees individually; the code for ‘both knees’ was in our policy as not to be used and we have to code each knee separately or get a justified telling off by the MSK radiologist. If that’s wrong, what about the rest of the data? Take a point off for every error. Stop at zero – and probably tell someone it needs fixing.
Flawed – Is there a flaw in the data collection process? For example, you’ve been told the average time from arrival to triage for patients in the Emergency department resus is 30 mins. However, that’s the time it takes for the person to get to a computer after saving the patient’s life to complete the episode of care for the patient. Acknowledge the flaw and take it into account. However, do not tell the nurses that data quality needs to improve, so could they do the computer first; that is an ordered response to a chaotic situation. You will get funny looks.
How did your data score?
Less than 5? You should not use this for Simple or Complicated domains. Don’t expect to see cause and effect; if you do this could be random variation / coincidence or seasonal variation.
More than five less than 10? This is ‘dirty data’ – ok for strategic decisions but not to be relied on. Ask colleagues what they think. Invite dissent. This works for Complex domains but understand the limitations; this kind of data can lead to false assumptions.
Plot all the data and eyeball it. Are there duplicate categories? blanks? Are there good reasons? Depending on the domain type, the 1% could be the issue ‘tipping’ the situation into chaos and you’d miss it. Pareto charts can be misleading here.
Depending on the domain type, the 1% could be the issue ‘tipping’ the situation into chaos and you’d miss it.
Scoring between 10 and 15 is fairly good and with a bit of refining can be used in the complicated domain. Often categories need redefining before Pareto charts are helpful to get an idea of the key issues, but depending on the domain, multiple changes in parallel might be required to create a shift.
Between 15 and 20? Normally this means a few blank cells here or there, a few outliers that need looking up before the next steps of analysis or some data needs stitching together to make it useful. Fine for the Simple data but make sure to share limitations for Complicated data before asking for decisions. Data analysts can use this information in the Complex domain to shift it into Complicated as long as caveats are explained.
20 – You’ve got the holy grail, you’ve reached data nirvana. It’s a thing of beauty. How often has that happened? Never. You’ve either been too generous with your scoring, or the issue hasn’t made itself apparent. For example: all is present and correct but multiple different processes of how the data is put in for the same task by different professionals or the system doesn’t have an option to leave something blank, so people will put anything in. Orthopaedic surgeons apparently doing hysterectomies in theatre and their patients teleport between hospitals in seconds. Process mapping the data input is hard work but worth it to lay foundations for later improvement work.
“So what? I have a good / rubbish score?”
You can now communicate the limitations to others which is very useful if you can get support from an analyst to look at this for you.
If you have a pretty bad score and want to improve the systems which collate the data or explain the limitations, I will cover this in my next blog on implementing the CSWME framework.
Do you implement ‘FUPS’ for data management, Q community? Leave your thoughts below.